Figure 1.
Phenotypic Characterization of mft Mutants in Arabidopsis.
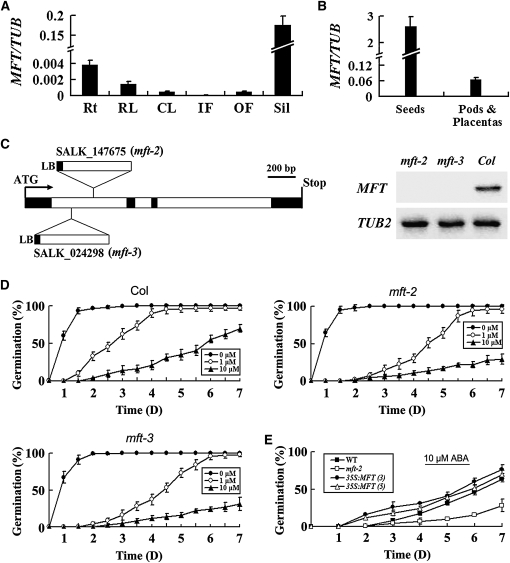
(A) Quantitative real-time PCR analysis of MFT expression in various tissues. Results were normalized against the expression of TUB2. Rt, roots; RL, rosette leaves; CL, cauline leaves; IF, inflorescences without open flowers; OF, open flowers; Sil, siliques. Error bars denote sd.
(B) MFT expression determined by quantitative real-time PCR in developing siliques dissected into seeds and pods plus placentas. Error bars denote sd.
(C) Schematic diagram indicating the T-DNA insertions in two mft loss-of-function mutants, mft-2 (SALK_147675) and mft-3 (SALK_024298). Black and white boxes indicate exons and introns of MFT, respectively. RT-PCR analysis using a pair of primers flanking the T-DNA insertion sites did not detect MFT expression in mft-2 and mft-3, indicating that both of them are null alleles.
(D) Germination phenotype of the wild type, mft-2, and mft-3 treated with different concentrations of ABA (0, 1, and 10 μM). Error bars denote sd.
(E) Germination phenotype of two representative 35S:MFT lines (3 and 5) in response to 10 μM ABA. Error bars denote sd.

