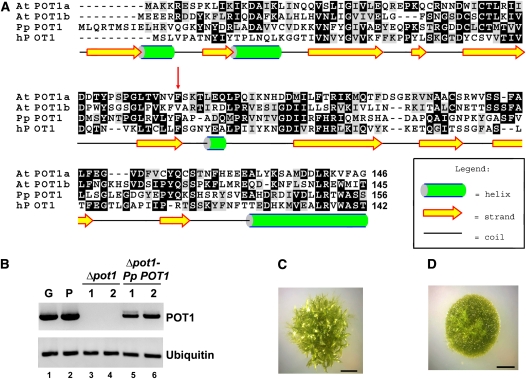
Figure 2.
Identification and Analysis of P. patens POT1.
(A) Amino acid alignment of the predicted Pp POT1 OB1 region with Arabidopsis (At POT1a and At POT1b) and human POT1 proteins. The secondary structure of Pp POT1 OB1 was predicted with PsiPred software (McGuffin et al., 2000). Numbers indicate amino acid positions relative to the start codon. Red arrow indicates the position of a biochemically important F62 residue in human POT1 and the corresponding amino acid F74 in Pp POT1. Alignment was generated with MEGA 3 software (Kumar et al., 2004) and visualized in the BOXSHADE format.
(B) RT-PCR results of Pp POT1 gene expression (top panel) in the wild type (lanes 1 and 2), Δpot1 (lanes 3 and 4), and Δpot1-Pp-POT1 complemented line (lanes 5 and 6). Ubiquitin (bottom panel) was used to normalize for RNA loading.
(C) and (D) General morphology of wild-type (C) and Δpot1 (D) colonies at the 4-week-old stage. The wild-type colony harbors multiple leafy-like gametophores, but only filamentous protonemata tissue is visible in Δpot1.

