Figure 4.
Distribution of Ds Reinsertions Relative to Chromosome Annotations.
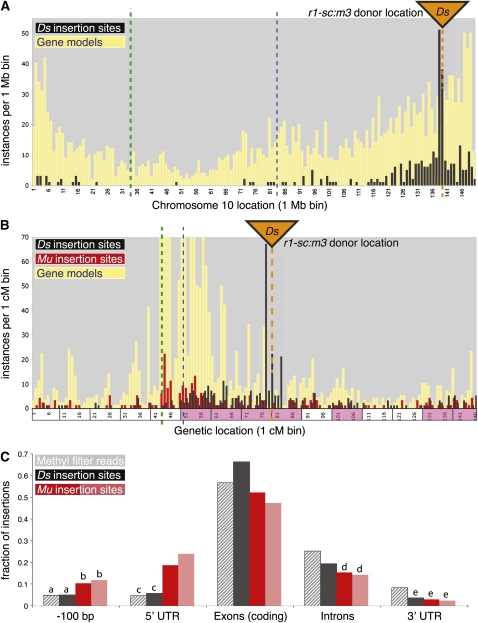
(A) and (B) Detail analysis of intrachromosomal reinsertions on chromosome 10.
(A) Vertical bars indicate the number (y axis) of gene models (yellow, from maizesequence.org release 4a.53) or Ds insertions (black) relative to their binned positions in the pseudomolecule assembly (1-Mb bin size, x axis); bin 1 refers to coordinates 0 to 1 Mb, bin 2 refers to 1 to 2 Mb, etc. Orange triangle and dotted line both indicate the position of the donor locus, r1-sc:m3; heavy, green dotted line is the centromere region; thin, blue dashed line is a landmark location for referencing between (A) and (B).
(B) A genetic map plot is constructed similarly to (A), except the x axis is converted to 1-cM units. Frequency distribution of a subset of Mutator insertions is also plotted (red bars). Adjacent, 10-cM super-bins are shaded magenta on the x axis if their density of Ds insertions is greater than expected by chance (P value < 0.001). The y axis is truncated at 100 instances per 1-cM bin, so the gene model is not shown for nine of the 146 bins (maximum value = 349 genes/cM).
(C) Genome-wide analysis of insertion site positions relative to gene annotation on maize pseudochromosomes. Gray bars are random hypomethylated (control) sequences; other bars indicate Ds (black), UniformMu (dark red), and RescueMu (light red) insertion sites. Each subcategory is mutually exclusive; for example, exons with UTRs are excluded from “coding exons.” Statistically indistinguishable values are marked with the same letter.

