Figure 5.
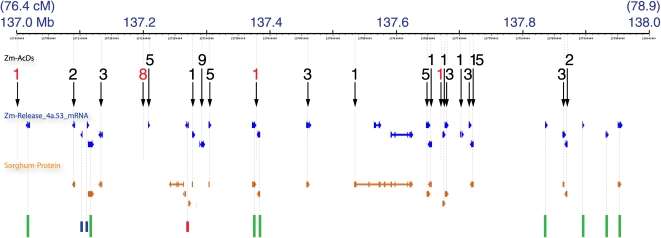
Fine-Scale Relationship of 74 Ds Insertions to Genes in a 1-Mb Interval of Chromosome 10: Ds Hits Most Genes in the Interval.
View of the chromosome 10 pseudomolecule (build 1) based on the genome browser at PlantGDB (http://www.plantgdb.org/ZmGDB/cgi-bin/getRegion.pl). Top, scale for interval. First track, positions of 74 nonredundant Ds insertions in 21 insertion clusters (black arrows) with the number of Ds per cluster. Black numeral, cluster aligns with a gene model; red numeral, cluster is not within a gene model. Second track (blue), nonredundant gene models from maizesequence.org release 4a.53. Third track (orange), sorghum peptides mapped to maize. Bottom track (colored lines), annotated genes that are not hit by Ds. Green lines, well-supported gene models; short blue lines, gene models with only one or two ESTs as support and no sorghum peptide; red line, gene model whose supporting ESTs have a better match on a different chromosome. Faint, dotted lines connect coincident gene and transposon features and indicate their approximate genome coordinates.

