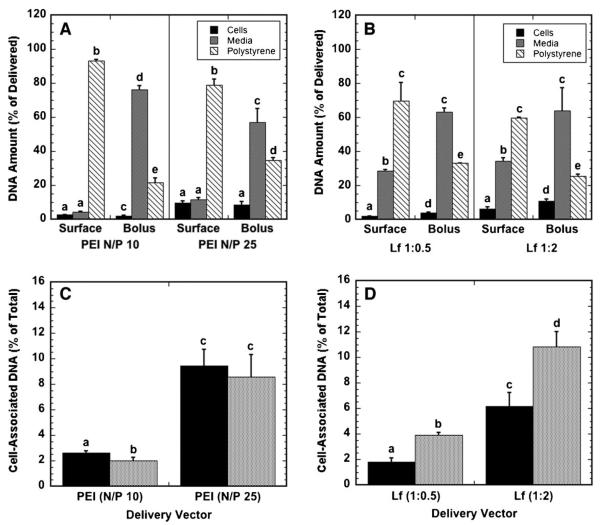
Figure 2.
Localization of DNA following polyplex and lipoplex delivery. The percentage of DNA delivered that is associated with cells, in growth media and on the substrate for polyplexes (A) and lipoplexes (B), and the percentage of DNA delivered that associates with cells for polyplexes (C) and lipoplexes (D) delivered from a substrate (black bars) and as a bolus (gray bars) to NIH/3T3 cells are shown. Data are presented as an average of triplicate measurements ± standard deviation of the mean. A statistical significance with P < 0.05 is denoted for values with different letters, with comparisons made only within the same N/P ratios.

