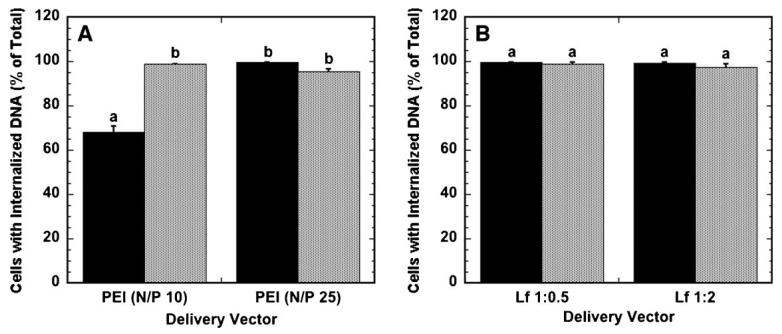
Figure 4.
Percentage of cells with internalized DNA. The percentage of cells that have internalized DNA when delivered as polyplexes (A) and lipoplexes (B) from the substrate (black bars) and as a bolus (gray bars) is shown. Data are presented as an average of triplicate measurements ± standard deviation of the mean. A statistical significance with P < 0.05 is denoted for values with different letters.

