
Figure 7.
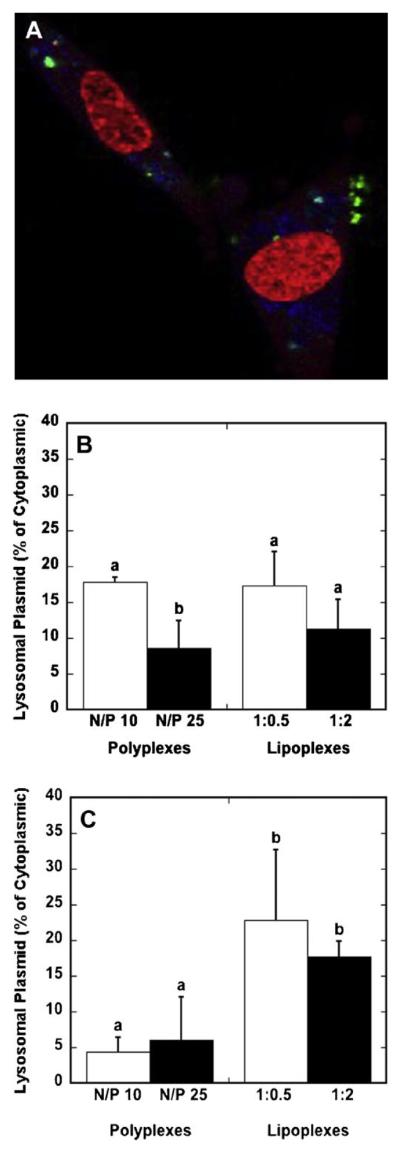
Lysosomal DNA levels. Cells were exposed to DNA complexes for 24 h prior to imaging. A representative confocal microscopy image depicting lysosomes (blue), Cy3-labeled plasmid (green) and nucleic acid staining (red) is shown (A). The quantity of lysosomal DNA as a percentage of cytosplasmic DNA was quantified by confocal microscopy for polyplexes and lipoplexes for delivery as a bolus (B) and from a substrate (C). Data are presented as the mean ± standard deviation of the mean. A statistical significance with P < 0.05 is denoted for values with different letters. [Color figure can be seen in the online version of this article, available at www. interscience.wiley.com.]