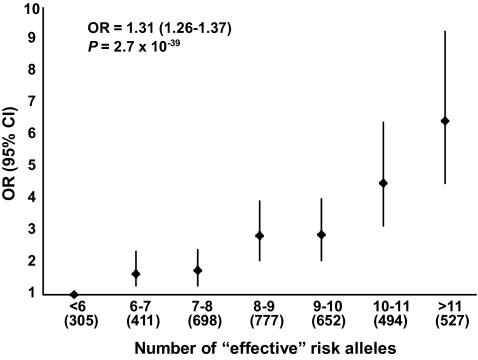
FIG. 1.
Effect of increase in the number of “effective” risk alleles on the risk of type 2 diabetes in combined samples. OR and 95% CI are plotted on the y-axis for the corresponding number of “effective” risk alleles on the x-axis. Numbers in parentheses on x-axis indicate sample size in each category.

