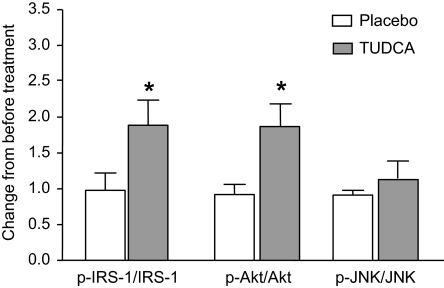
FIG. 2.
Effect of placebo (□) or TUDCA ( ) treatment on skeletal muscle IRSTyr, AktSer473, and JNKThr183/Tyr185 levels. Values are means ± SD and expressed relative to values before treatment, which were set to one for each person. *Value significantly different from corresponding placebo value, P < 0.05.

