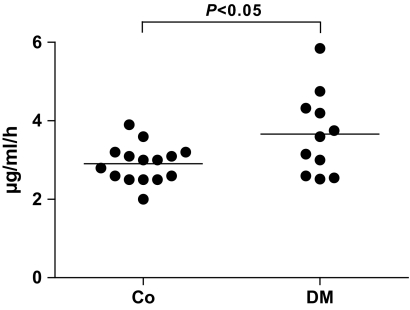
FIG. 4.
CN-1 activity was measured in 5L homozygous healthy control subjects (Co, n = 15) as well as in 5L homozygous diabetic patients (DM, n = 11). Results are expressed for each individual patient and control. The line represents the mean of each group. Co, healthy control subjects; DM, 5L homozygous diabetic patients.

