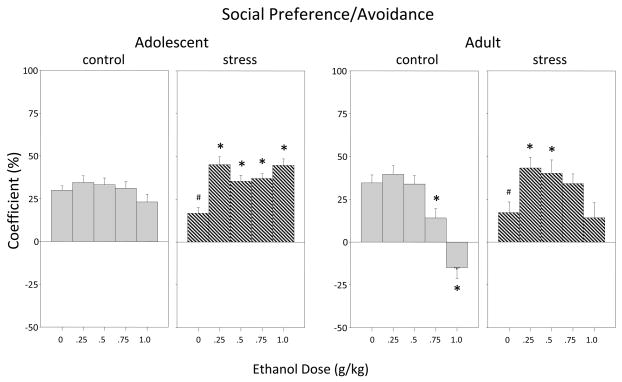
Figure 3.
The impact of repeated restraint on ethanol-related alterations in coefficients of social preference/avoidance during the 10-min. social interaction test among adolescent and adult male and female rats. Data are collapsed across sex and are shown for control (gray bars) and repeatedly stressed (hatched bars) animals. Asterisks (*) indicate significant differences from the corresponding saline control group, whereas pound signs (#) indicate significant reductions in behavior among stressed animals relative to non-stressed saline controls within that age group (p ≤ .05).

