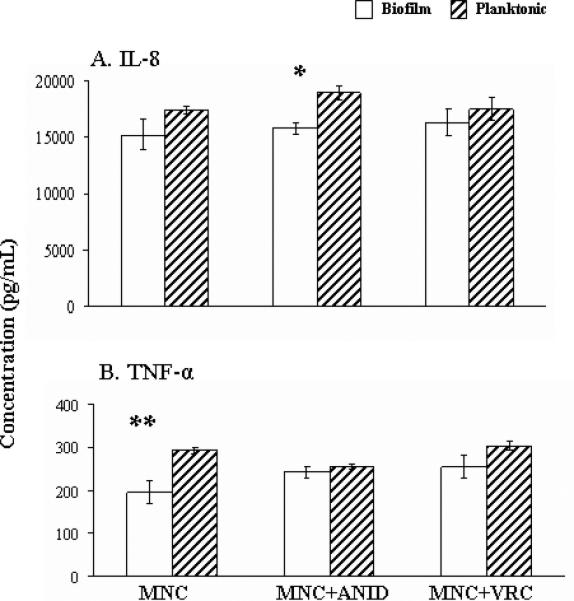
Figure 3.

Profiles of IL-8 (panel A) and TNF-α (panel Β) release after incubation of THP-1 cells (MNCs) alone or in combination with ANID (0.5 mg/L) or VRC (2.0 mg/L) and C. albicans biofilms (open columns) or planktonic cells (stripped columns) at 37°C for 22 h. Data are presented as means ± standard errors of the means derived from five experiments. Comparisons between biofilm and planktonic conditions were performed with Student's t test. * P = .007, ** P = .001.
