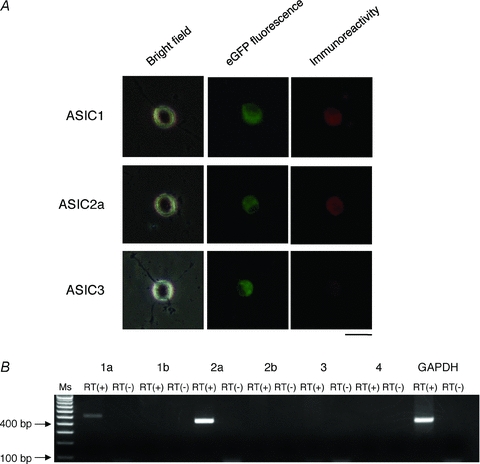
Figure 3. Expression of ASIC subunits in AVP-eGFP neurons in the SON.

A, immunostaining showed expression of ASIC1 and ASIC2a, but not ASIC3. Red indicates immunostaining for ASIC subunits, green indicates expression of AVP-eGFP. Scale bar indicates 50 μm. B, multi-cell RT-PCR revealed expression of mRNA encoding ASICs1a and -2a but not mRNA encoding the other subunits. Ms indicates 100-bp marker ladder, RT(–) indicates negative control lacking reverse transcriptase.
