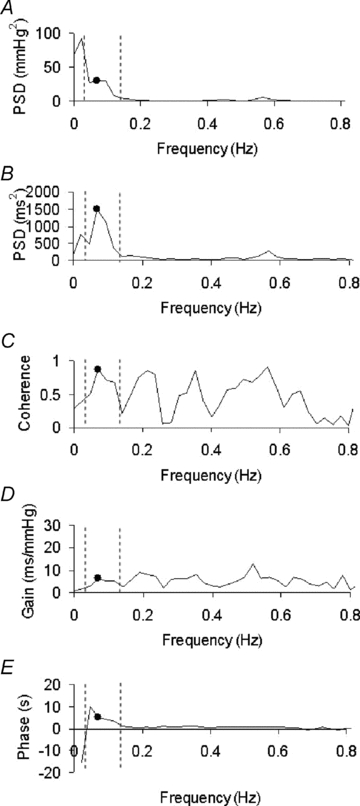
Figure 1. Spectral power curves, transfer function and coherence parameters of blood pressure and heart period recordings measured in an infant at 2–3 months postnatal age.

This figure shows the results of spectral analysis from a 1–2 min epoch of continuous blood pressure and heart period recording. The dashed lines represent the low-frequency range used to assess baroreflex changes (0.04–0.15 Hz.). A, the power spectral density of fluctuations in systolic blood pressure. Note the significant power in the low frequency band and the decline above 0.09 Hz. B, the power spectral density for heart period fluctuations. Note that peaks occur at 0.07 Hz, within the range of baroreflex mediated changes (Robbe et al. 1987; Task Force of the European Society of Cardiology and the North American Society of Pacing and Electrophysiology, 1996) and at 0.57 Hz corresponding to respiratory modulation at the infant's respiratory frequency ∼40 breaths min−1.C–E, the coherence, gain and phase delay of the relationship. Dots indicate the values of each spectral parameter at the frequency of maximum coherence (0.07 Hz, C). Values of gain at this frequency were used to determine baroreflex sensitivity (BRS), and values of phase to determine heart period time delay of the baroreflex loop (HPD).
