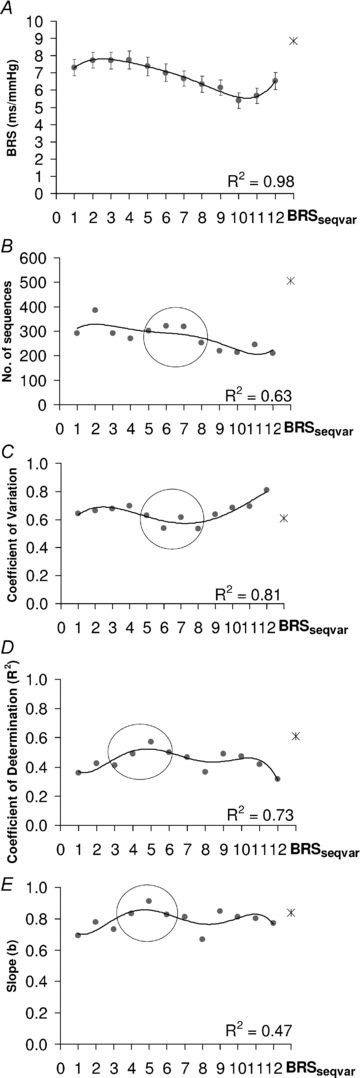
Figure 4. Effect of different heart period delays (HPDs) on BRS estimates in the time domain.

Effect of different heart period delays (HPDs) on mean baroreflex sensitivity (BRS) (A), number of sequences yielding heart period–systolic blood pressure regression of R2 > 0.8 (B), coefficient of variation for BRS (C), the coefficient of determination (R2) for the regression between BRSsp and spontaneous BRSseq (D), and the slope for the regression between BRSsp and spontaneous BRSseq (E). BRS was estimated from 1–2 min epochs of blood pressure and heart period epochs (n= 180) during quiet sleep in infants aged 2–4 weeks, 2–3 months and 5–6 months postnatal age (n= 30). A total of 13 separate sequence analyses were performed using different HPD: one sequence with a variable HPD (BRSseqvar, represented by the star) and 12 using a fixed HPD of 1–12 beats, represented by filled circles. Regression equation: Y=aXb. R= correlation coefficient between logY and logX. To characterise any trends for fixed beat delay criteria, 5th order polynomial regression was fitted. BRSseqvar yielded the highest value of BRS (A), number of sequences (B), and R2 (D) and slope (E) for the regression between BRSsp and BRSseq. For fixed beat delays, the number of sequences was highest and coefficient of variation lowest with fixed HPD of mid range (circle). Note (1) the steep decline in BRS for fixed beat delays of >6 beats, (2) the high yield of sequences of R2 > 0.8 (see text) for delays of 5–8 beats, (3) the low coefficient of variation of BRS estimates for delays of 5–8 beats, and (4) the peak values for R2 and slope for fixed HPD at 5 beats (circle).
