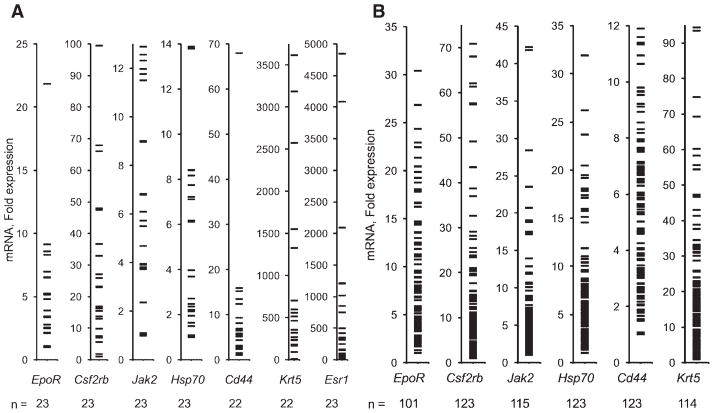
Figure 3.
Range of mRNA levels in primary tumors. Relative quantification values are shown as fold differences, with the value from the lowest-expressing tumor assigned a value of 1. Numbers at the bottom of each graph indicate the number of tumors for which data were obtained. (A): Results for breast tumors. (B): Results for head and neck tumors from ENHANCE.

