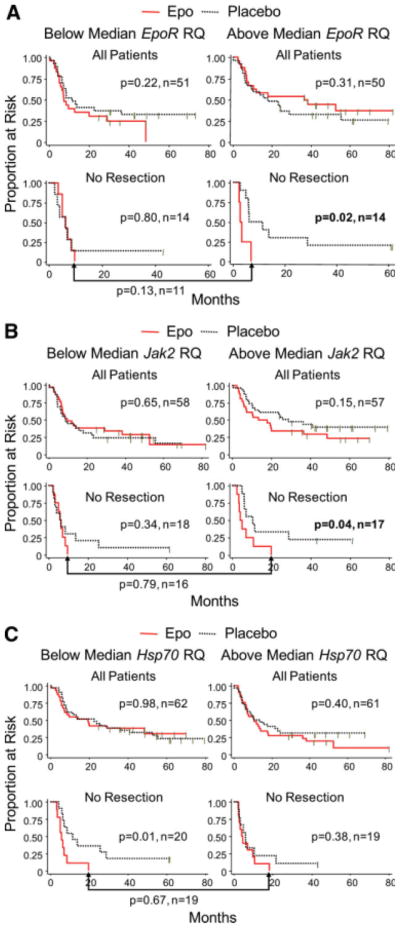
Figure 4.

Effects of exogenous Epo on LPFS with stratification by mRNA status. Outcomes in response to Epo versus placebo are shown in Kaplan-Meier plots. The log-rank p value is two sided. Comparisons of outcomes of patients randomized to Epo are indexed below the brackets. (A): Results for EpoR. (B): Results for Jak2. (C): Results for Hsp70. Hsp70 mRNA measurements reflect the cumulative expression of all eight family members.
