FIGURE 6.
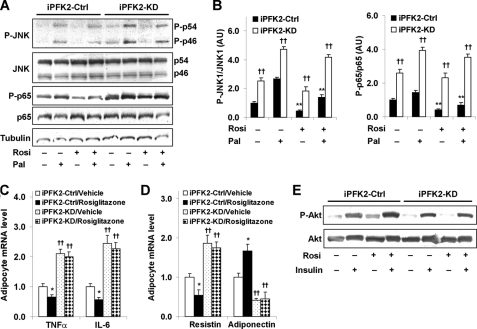
Knockdown of PFKFB3/iPFK2 diminishes the effects of PPARγ activation on both suppression of adipocyte inflammatory response and improvement of adipocyte function. After differentiation for 6–8 days, stable iPFK2-KD and iPFK2-Ctrl adipocytes were treated with rosiglitazone (Rosi; 1 μm) or vehicle (0.1% DMSO) for 48 h in the presence or absence of palmitate (Pal; 250 μm) for the last 24 h. Thereafter, the treated cells were subjected to the assays described under “Experimental Procedures.” A, changes in inflammatory signaling were analyzed using Western blots. For B–D, data are means ± S.E., n = 4. B, quantification of inflammatory signaling (arbitrary units). Left, phospho-JNK1 (P-JNK1)/JNK1; right, phospho-p65 (P-p65)/p65. **, p < 0.01, iPFK2-Ctrl treated with Rosi versus iPFK2-Ctrl treated without Rosi in the presence or absence of Pal. ††, p < 0.01, iPFK2-KD versus iPFK2-Ctrl under the same condition. For C and D, the expression of proinflammatory cytokines (C) and adipokines (D) was measured using real-time RT-PCR. *, p < 0.05, iPFK2-Ctrl/rosiglitazone versus iPFK2-Ctrl/vehicle for the same gene. ††, p < 0.01, iPFK2-KD/vehicle versus iPFK2-Ctrl/vehicle or iPFK2-KD/rosiglitazone versus iPFK2-Ctrl/rosiglitazone for the same gene. E, adipocyte insulin signaling was analyzed using Western blot. Before harvest, the cells were incubated with or without insulin (100 nm) for 30 min. P-p46, phospho-p46.

