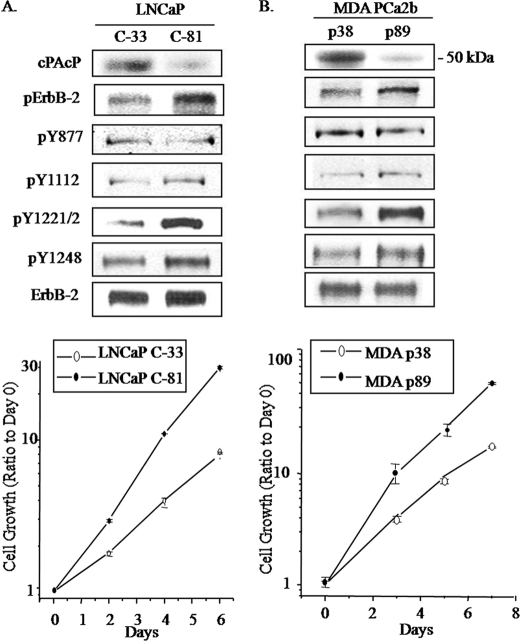
FIGURE 1.
Analyses of tyrosine phosphorylation of ErbB-2 in different LNCaP and MDA PCa2b cells. Upper panels, A, LNCaP C-33 and C-81 cells were seeded in regular culture medium at a density of 5 × 10⁵/T25 flask for 3 days. p indicates phosphorylation. B, MDA PCa2b cells (passages 38 and 89) were seeded with a density of 1 × 10⁶/T25 flask in regular culture medium. Cells were fed with fresh medium and cultured for another 2 days. Immunoblottings were performed with Abs to different tyrosine phosphorylation sites of ErbB-2. After stripping, the membrane was hybridized with Ab to detect ErbB-2 protein. Similar results were obtained from over three sets of independent experiments. Lower panels, growth rates of different LNCaP and MDA PCa2b cells. A, LNCaP cells were seeded at a density of 3 × 10⁴ cells/well in 6-well plates in the regular culture medium. 3 days after plating, one set of attached cells was harvested and counted as day 0. The remaining cells were refreshed with the regular medium, and the total cell numbers were counted on the indicated days. B, for MDA PCa2b cell growth kinetics, cells were seeded in regular medium at a density of 1 × 10⁵ cells/well in 6-well plates and counted on days 3, 5, and 7. Data shown are the ratios of cell numbers normalized to the corresponding number on day 0. Bars = the range of duplicates. Similar results were obtained from at least three sets of independent experiments. Y, tyrosine.

