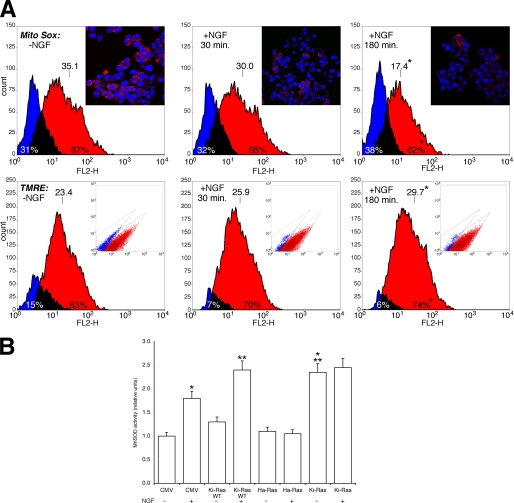
FIGURE 1.
A, NGF reduces mitochondrial ROS levels and stabilizes the proton gradient in PC12 cells. Upper panel, ROS levels were determined by MitoSOX fluorescence in cells treated with NGF at (100 ng/ml) for 30 and 180 min as indicated. The histogram was obtained by overlapping the regions identified by bivariate analysis. Overlay plots are shown, where blue and red colors indicate the negative and positive cells, respectively. The number of cells and the intensity of the fluorescence are shown on the ordinate and abscissa, respectively. The inset shows representative micrographs of the same cells stained with the specific nuclear dye DRAQ 5 (see “Experimental Procedures”). Lower panel, the mitochondrial proton gradient was measured by TMRE fluorescence-activated cell sorter analysis. Overlay plots are shown, where blue and red indicate the negative and positive cells, respectively. The inset shows the different populations of the cells identified by bivariate analysis. Overlay plots are shown, where blue and red colors indicate the negative and positive cells, respectively. *, p < 0.01 relative to cells without NGF. B, MnSOD activity in Ha and Ki-Ras-expressing cells is shown. Cells were transfected with expression vectors carrying the empty CMV vector, wild type Ki-Ras4B, Ha-Ras (Val-12), Ki-Ras (Val-12), described under “Experimental Procedures.” 48 h later cells were induced with NGF (100 ng/ml) for 30 min as indicated. MnSOD activity was carried out as described under “Experimental Procedures.”. Values, normalized to the transfection efficiency (RSV-LacZ), represent the means ± S.E. derived from at least three independent experiments performed in triplicate. *, p < 0.01 relative to untreated cells transfected with CMV. **, p < 0.02 relative to cells transfected with CMV and treated with NGF. ***, p < 0.01 relative to untreated cells expressing Ki-Ras wild type (WT).

