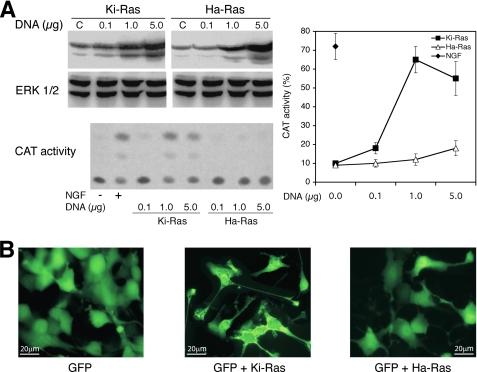
FIGURE 2.
Ha-Ras and Ki-Ras effects on PC12 differentiation. A, induction of NGF1A promoter transcription by Ki- and Ha-Ras is shown. PC12 cells were transfected with control vector, NGF1A promoter fused to CAT, and Ki- or Ha-Ras (Val-12) expression vectors. 40 h later the cells were serum-starved for 5 h and treated 4 h with 100 ng/ml NGF. The left upper panel shows the immunoblot with Ha- and Ki-Ras-specific antibodies of extracts derived from cells transfected with various concentrations of Ha- or Ki-Ras expression vectors. The left lower panel shows a representative CAT assay, where the lower and the upper spots indicate the input chloramphenicol and the acetylated products, respectively. The right panel shows the CAT activity (% of acetylated chloramphenicol) normalized to the transfection efficiency (β-galactosidase activity). The values shown represent the means ± S.E., derived from at least three independent experiments performed in triplicate. Total p-ERK and GTP binding activity were comparable in cells transfected with 1 and 5 μg/dish DNA of both Ras vectors. B, neurite outgrowth in cells expressing Ha- or Ki-Ras is shown. Ha- and Ki-Ras expression vectors contain the internal ribosome entry site of the encephalomyocarditis virus upstream of the GFP gene (“Experimental Procedures”) and express co-translationally GFP. Cells transfected, as described in A, were analyzed by fluorescence microscopy 72 h later. Specifically, neurites were scored in 200 cells GFP+: control, 4 ± 1.78%; Ki-Ras, 40 ± 9.13%; Ha-Ras 15 ± 5.61%. For each experiment the p value of the χ2 was <0.001; across the experiment the p values of the t tests were: Ki-Ras versus control, p < 0.0001; Ha-Ras versus control, p = 0.0011; Ki-Ras versus Ha-Ras, p < 0.0001.

