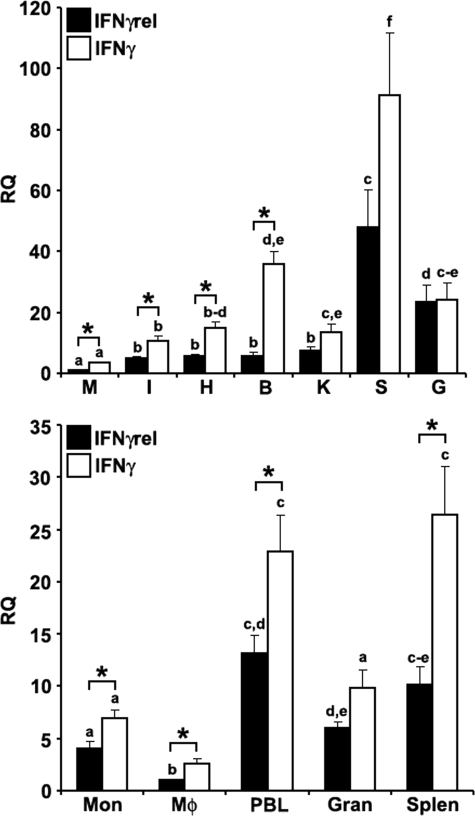
FIGURE 1.
Quantitative expression analysis of goldfish IFNγ and IFNγrel in tissues and immune cell populations obtained from healthy fish. Top, goldfish IFNγrel tissue expression analysis. The tissues examined were: muscle (M), intestine (I), heart (H), brain (B), kidney (K), spleen (S), and gill (G). The expression of goldfish IFNγrel was assessed relative to endogenous control gene, elongation factor 1 α (EF-1α). Analyses of the relative tissue expression data are for tissues from five fish (n = 5). All results were normalized against the muscle IFNγrel expression levels. Bottom, goldfish IFNγrel expression in different immune cell populations. The cells examined were: monocytes (Mon), macrophages (Mϕ), peripheral blood leukocytes (PBL), granulocytes (Gran), and splenocytes (Splen). Immune cells populations were derived from four fish (n = 4) and the expression normalized against that of FACS-sorted macrophages. Direct comparisons of IFNγ and IFNγrel expression was achieved by performing ddCT analysis using lowest expression as the standard for the expression of both cytokines. The RQ values were normalized against the lowest observed tissue or cell expression (IFNγrel, muscle, and monocytes, respectively). Statistical analysis was performed using one-way ANOVA. Different letters above each bar denote significant differences (p < 0.05), the same letter indicate no statistical difference between groups.

