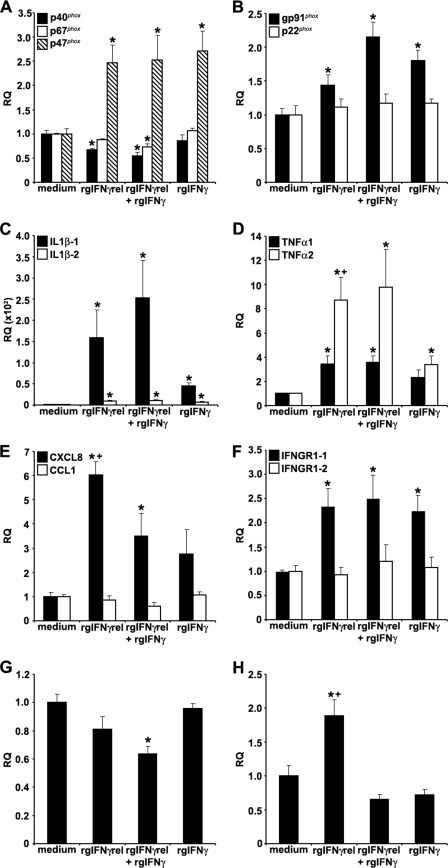
FIGURE 2.
Quantitative expression analysis of goldfish immune genes in monocytes stimulated with rgIFNγrel, rgIFNγ, or a combination of both cytokines. The reported expression was relative to EF-1α. The genes examined included: (A), p40phox, p47phox, p67phox; (B) gp91phox, p22phox; (C) IL-1β-1, IL-1β-2; (D) TNFα1, TNFα2; (E) CXCL8, CCL1; (F) IFNGR1–1, IFNGR1–2; (G) TGFβ; (E) ceruloplasmin. The expression data were normalized against those observed in medium treated cells, respectively for each gene. The results are mean ± S.E. RQ values for monocytes obtained from cultures established from individual fish (n = 5). Statistical analysis was performed using one-way ANOVA, and the results were deemed to be significant at p < 0.05. (*) denotes significantly different (p < 0.05) from the respective medium treated controls and (+) denotes significantly different (p < 0.05) from respective rgIFNγ-treated cells.

