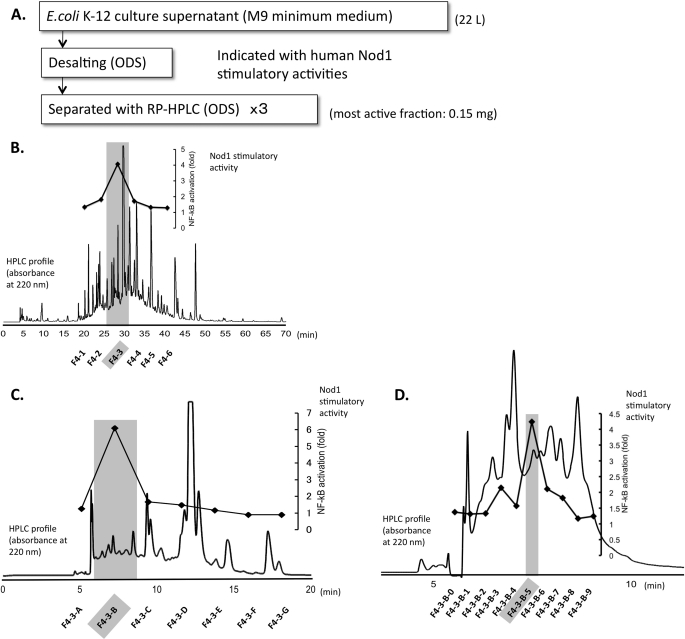
FIGURE 1.
A, isolation of fractions with Nod1 stimulatory activity from E. coli K-12 culture supernatant (M9 minimum medium). B, the HPLC profile and Nod1 stimulatory activities of fractions from the first cycle of RP-HPLC separation. Nod1 stimulatory activities were measured by using a 10 μg/ml sample prepared from lyophilized residues (F4–3: 8 mg in total). C, the second cycle of RP-HPLC separation. The dark-colored fraction from the first RP-HPLC separation was further separated with a second RP-HPLC purification. Nod1 stimulatory activities were measured by using a 5 μg/ml sample prepared from lyophilized residues (F4–3-B, 3.6 mg in total). D, the third cycle of RP-HPLC separation. The dark-colored fraction from the second RP-HPLC separation was further separated with the third RP-HPLC condition. Nod1 stimulatory activities were measured by using a 0.1 μg/ml sample prepared from the lyophilized residues (F4–3-B-5, 0.15 mg in total). The dark-colored fraction was corrected and analyzed with ESI-QTOF MS, MS/MS, and NMR. Details on the HPLC conditions are as described under “Experimental Procedures.”

