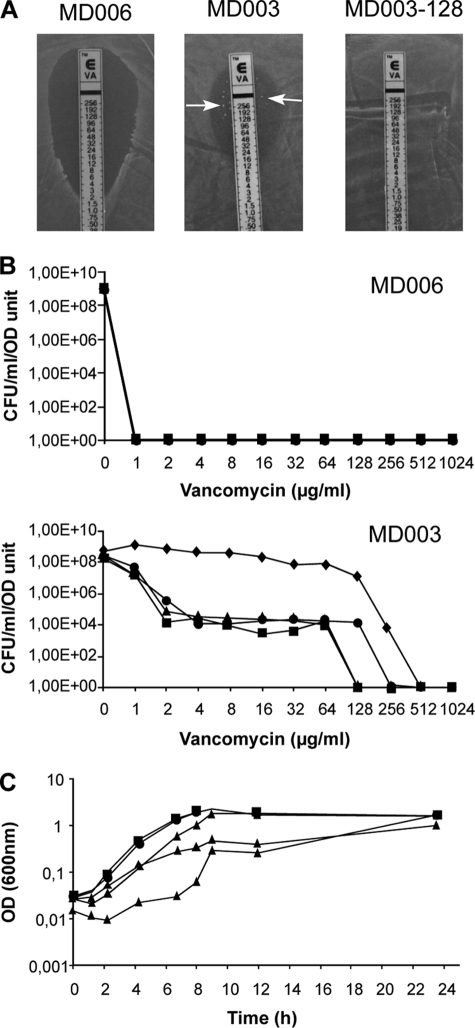
FIGURE 3.
Phenotypic adaptation to d-Lac-ended peptidoglycan precursors in L. lactis. A, shown are representative vancomycin antibiograms obtained for the control strain MD006, the primary mutant MD003, and its vancomycin-resistant derivative MD003-128 by the E-test method (see “Experimental Procedures”). Arrows indicate the presence of highly resistant colonies in the E-test inhibitory zone obtained for MD003. B, evolution of vancomycin resistance within cell populations of the MD006 (top) and MD003 (bottom) primary mutants is shown. Dilutions of serial cultures of both mutant strains were plated on increasing concentrations of vancomycin. Graphs express the number of colony forming units (CFU) per ml and A600 nm units of the cultures obtained at each vancomycin concentration after 10 (squares), 20 (circles), 30 (triangles), and 40 (diamonds) generations. C, shown is growth rate comparison between the MD003 primary mutant and its vancomycin-resistant derivative MD003-128. Three independent cultures of the control strain MD006, the vancomycin-resistant clone MD003-128, and the MD003 primary isolate were performed in M17-glucose supplemented with erythromycin (5 μg/ml), chloramphenicol (5 μg/ml), d-Lac (20 mm), and nisin (0.5 ng/ml). Growth of the cultures was followed by measuring the A600 nm as a function of time. For MD006 (squares) and MD003-128 (circles), mean values obtained for the three cultures are plotted. For MD003 (triangles), the growth curves obtained for the three independent cultures are shown.

