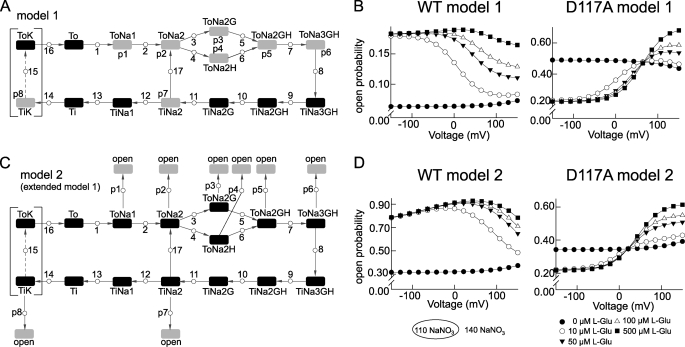
FIGURE 7.
Kinetic model of the EAAT4 transporter. A, state diagram of the stoichiometrically coupled glutamate transport cycle (model 1) based on a published rEAAT2 model (29). The transport process is assumed to be unaltered by the channel being open or closed. B, simulated WT and D117A EAAT4 activation curves using model 1. C, modified state diagram that assumes explicit switching between anion conduction and transport mode (model 2). D, simulated WT and D117A EAAT4 activation curves using model 2 shown in C.

