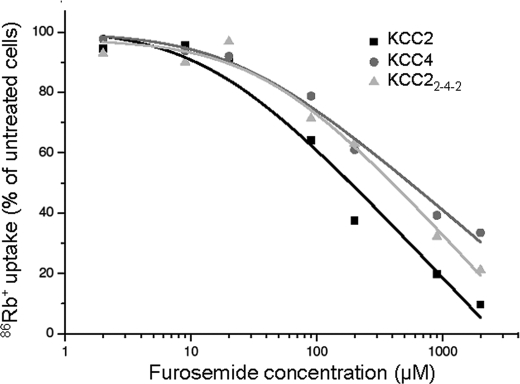
FIGURE 7.
Concentration-response profile for inhibition of KCC2, KCC4, and KCC22-4-2 by furosemide. Transfected HEK-293 cells with KCC2, KCC4, and KCC22-4-2 were exposed to increased furosemide concentration from 2 to 2000 μm in the preincubation and uptake buffer. The activity of untreated cells of the respective KCC was normalized to 100%. IC50 values were determined by using logarithmic regression analysis. The plot depicts the mean of four experiments ± S.D. ***, p < 0.001.

