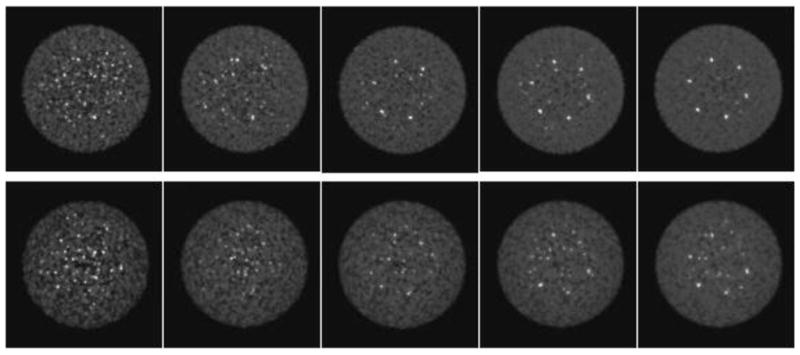
Figure 5.

Images from one replicate of measured lesion phantom with 400-ps timing resolution for different count densities (top) with and (bottom) without TOF information. From left to right, the number of coincidences is 9, 18, 27, 41, and 54M. The iterations of the TOF (4) and non-TOF (6) images shown were chosen to match the noise for the 54-Mct reconstructions (and kept the same for the lower count images).
