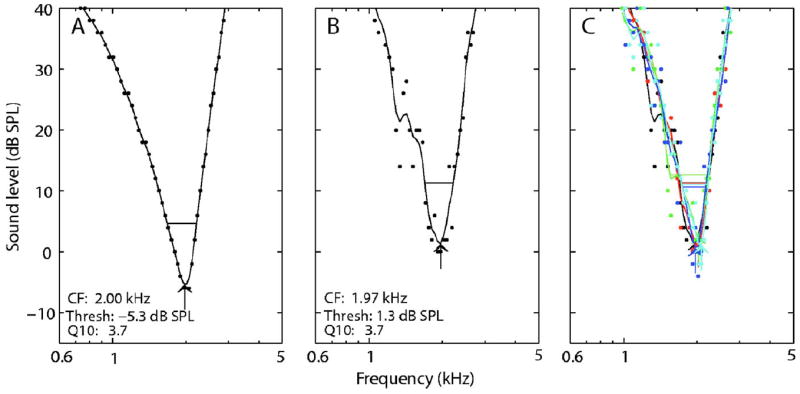
Fig. 1.

(Color online) Tuning curves measured by the adaptive algorithm with and without randomness for an AN-model fiber with CF = 2.0 kHz and SR = 50 spikes/ s. (A) AN model without randomness. Individual data points represent the thresholds estimated by the adaptive algorithm at each frequency. Solid lines represent a smoothed curve (see the text). Identical tuning curves were obtained with repeated measures. (B) AN model with randomness. (C) Five repeated tuning curves with randomness. Derived parameters for the individual repetitions are: CF (kHz) = 1.97,2.02,2.02,1.97,2.08; geometric mean = 2.01; and range = 0.08 octaves. Threshold (dB SPL) = 1.3,1.3,2.7,0.7,1.1; mean = 1.4; range = 2.0 dB. Q10 = 3.7,3.7,3.0,4.6,4.2; geo. mean = 3.8; range=0.62 octaves. The information may not be properly conveyed in black and white.
