
Fig. 2.
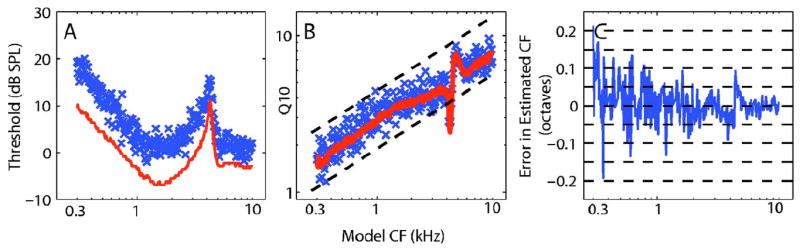
(Color online) (A) Populations of thresholds, (B) Q10 values, and (C) CF errors estimated from tuning curves measured for 250 model AN fibers. (A and B) Each symbol (X) represents the estimated value with randomness and red lines represent nonrandom estimates. (B) Black dashed lines represent the range between the 5th and 95th percentile of experimental Q10 values within each CF region (Miller et al., 1997). (C) Error in estimated CFs from tuning curves measured when randomness was included. CF error in octaves is computed as log2 (estimated CF/model CF). The information in (A) and (B) may not be properly conveyed in black and white.