
Fig. 3.
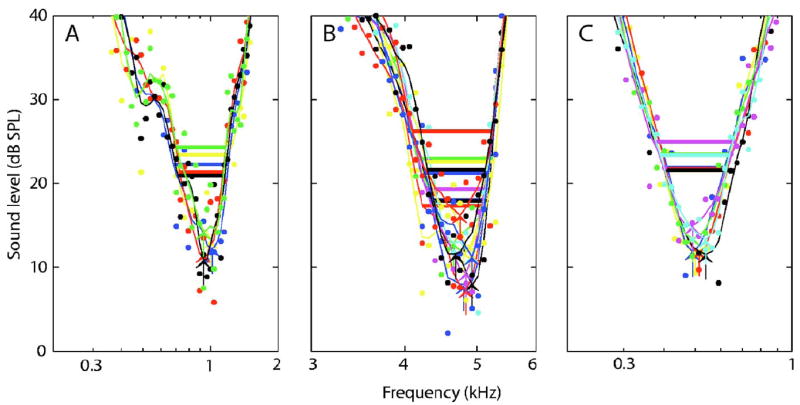
(Color online) Repeated tuning curves measured from three AN fibers from chinchillas, which vary in SR and CF. Derived parameters for the individual repetitions are: (A: SR = 58.8 spikes/ s) CF (kHz) = 1.00,1.00,0.96,0.96,0.93; geometric mean = 0.97; range = 0.11 octaves. Threshold (dB SPL) = 13.4,12.3,11.4,10.9,14.3; mean = 12.5; range = 3.4. Q10 = 2.3,1.9,2.4,2.2, 2.0; geo. mean = 2.2; range = 0.34 octs. (B: SR = 54.6) CF = 4.75, 4.75,4.84,4.93,4.66,4.84,4.93,4.93,4.93,4.75,4.66; geo. mean = 4.78; range = 0.08 octs. Threshold = 11.5,8.0,7.3,7.9,12.9,9.3,11.5,12.6,11.2,16.2,11.6; mean = 9.5; range = 5.6. Q10 = 4.4,5.9,5.5,6.0,4.5,5.7,6.1,4.9,5.4,4.1,5.6; geo. mean = 5.2; range = 0.45 octs. (C: SR = 3.7) CF = 0.50,0.49, 0.51,0.54,0.49,0.49,0.54; geo. mean = 0.51; range = 0.14 octs. Threshold = 11.5,11.9,11.7,11.5,13.4,15.0,13.3; mean = 12.0; range = 1.9. Q10 = 2.2,2.4,2.3,2.1,2.0,1.7,2.2; geo. mean = 2.2; range = 0.26 octs. The information may not be properly conveyed in black and white.