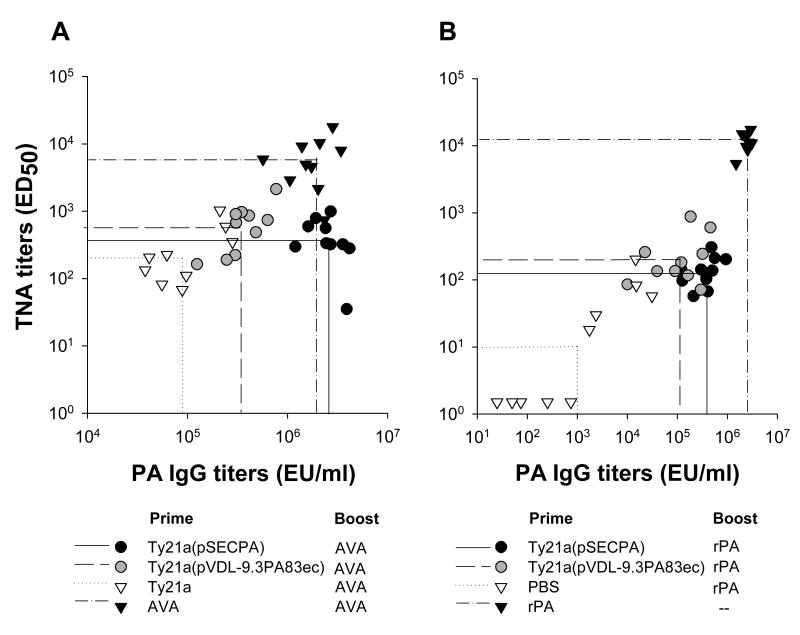
Figure 6.
Correlation of TNA antibody titers vs. PA IgG levels. Mice were primed with Ty21a(pSECPA) or Ty21a(pVDL9.3PA83ec) on days 0, 28 and 56 and boosted rPA (1 μg) or AVA on day 112. Control groups received 2 doses of AVA on days 0 and 112 (A) or 3 doses of rPA (10 μg/dose) on days 0, 28 and 56 (B). Data represent individual TNA and ELISA titers for each group on days 140 (A) and 180 (B) after primary immunization (28 and 68 days after the boost, respectively). Lines are plotted upon the GMT for each group.

