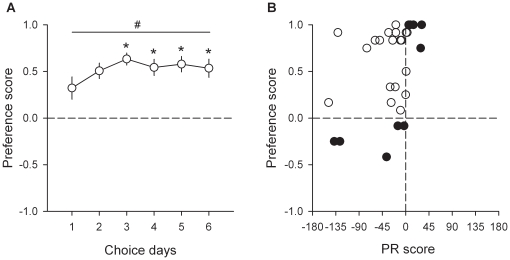
Figure 3. Comparison between reward assessment procedures.
(A) Choice between water sweetened with saccharin and cocaine. The horizontal dashed line at 0 indicates the indifference level. Values above 0 indicate a preference for sweet water while values below 0 indicate a preference for intravenous cocaine. *, different from the first day (P<0.05, Fisher's LSD test following a one-way ANOVA); #, different from the indifference level (P<0.05, t-test). (B) Correlation between individual PR and preference scores. The x-axis corresponds to the PR score (difference in breakpoints between saccharin and cocaine; see Results) while the y-axis corresponds to the preference score as measured in the choice procedure (see Materials and Methods). The vertical dashed line at 0 indicates that the breakpoint of cocaine was equal to that of sweet water. Values on the left or on the right of this vertical line indicate that the breakpoint of cocaine is higher or lower than the breakpoint of sweet water, respectively. Open circles represent individuals whose PR and preference scores are incongruent; closed circles represent individuals whose PR and preference scores are congruent. Note that rats with a PR score ≥-3 or ≤3 (i.e., only one step size in the PR3 schedule) were considered to work equally for both types of reward.

