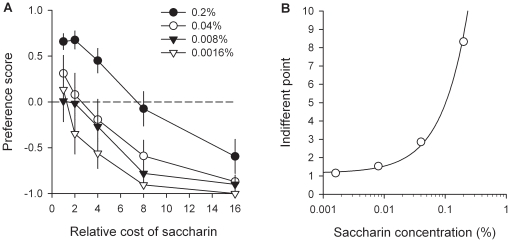
Figure 7. Estimation of the relative value of cocaine as a function of saccharin concentration.
Cost-effect curves for each saccharin concentration (A) were established in a within-session manner. Each concentration was tested at least 5 times consecutively until stabilization of behavior. Data curves represent the means (± s.e.m.) of the last 3 stable testing sessions. Indifferent points for each concentration of saccharin (B) were estimated by fitting the corresponding cost-effect curves using a normal sigmoid function. For other details, see Materials and Methods, and legend of Figure 6.

