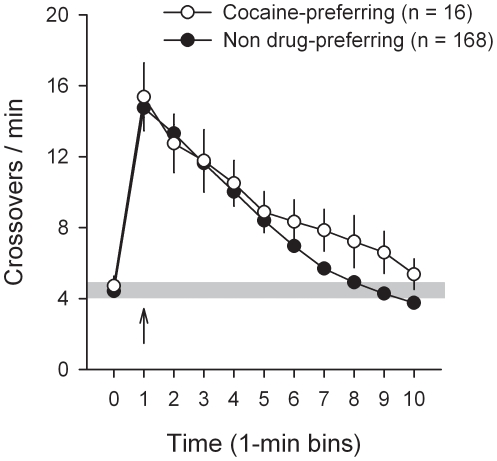
Figure 9. Cocaine-induced locomotion as a function of individual preference.
Locomotion (i.e., mean number of cage crossings per min ± s.e.m.) was measured during 10 min after the first cocaine sampling (0.25 mg, i.v.) and was averaged across the last 3 stable choice sessions for each individual. The arrow indicates the intravenous injection of cocaine. The shaded area indicates the mean pre-injection level of locomotion (± s.e.m.). Note that the first cocaine sampling was followed 10 min later by the first saccharin sampling.

