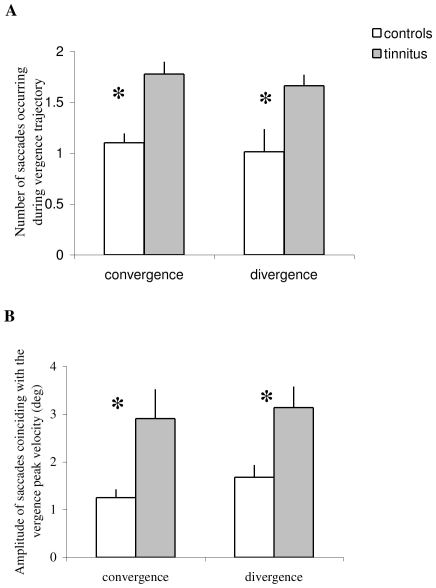
Figure 8. Embedded saccades.
(A) Group mean number of embedded saccades during complete execution of the vergence–total trajectory seen example in Fig. 2 from ‘i’ to ‘e’. (B) the group mean amplitude of the subgroup of saccades coinciding with the peak velocity of vergence. Tinnitus subjects show significantly more embedded saccades, and higher amplitude of coinciding saccades than controls (asterisks).

