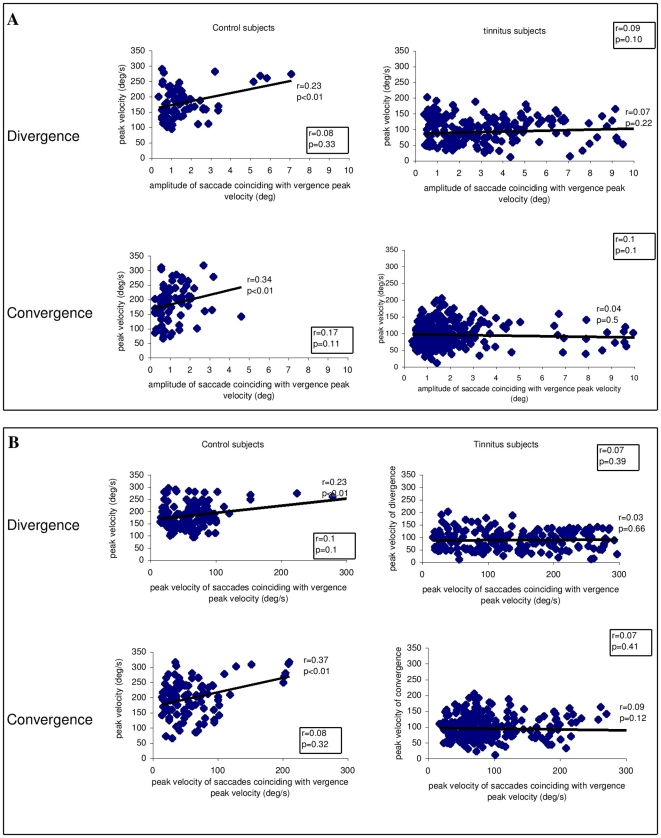
Figure 9. The correlation between the vergence and the coinciding saccades.
(A) The correlation between the peak velocity of vergence and the amplitude of saccades coinciding with the peak velocity of vergence; (B) the correlation between the peak velocity of vergence and the peak velocity of saccades coinciding with the peak velocity of vergence. Correlation coefficients ‘r’ and levels of significance are shown next to each cluster. Positive significant correlations for both divergence and convergence occur for controls but for tinnitus patients. Values in boxes indicate correlations for the subgroup of saccades with amplitudes equal or less than 4°; no significant correlation exists for controls or tinnitus.

