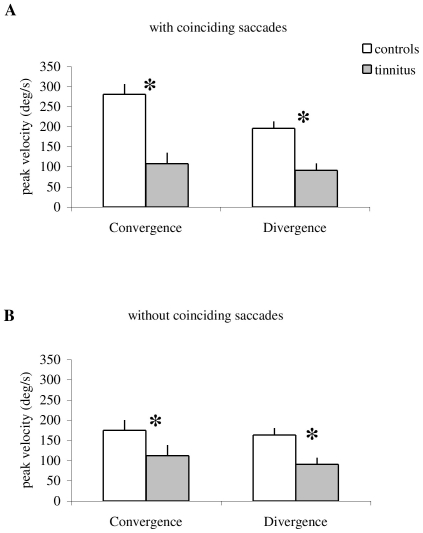
Figure 11. Group mean peak velocity of vergence.
With saccades coinciding with the peak velocity of vergence (A) and without such saccades (B). Tinnitus subjects show lower peak velocity of vergence than controls for all cases (asterisks). Also, for controls only, vergence velocity is higher with coinciding saccades than without such saccades.

