
Figure 6.
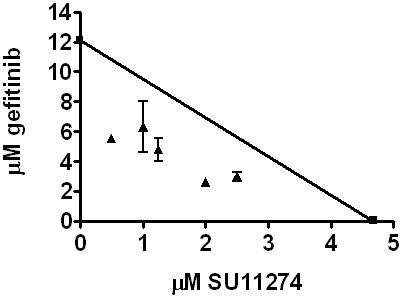
EGFR and Met inhibitor synergy in SUM229 cells. SUM229 cells were treated with various concentrations of gefitinib and SU11274 and the IC50 of gefitinib was calculated for each concentration of SU11274. A line was drawn between the IC50 for gefitinib (y-axis; 12.2 μM) and SU11274 (x-axis; 4.8 μM). The calculated IC50 values for gefitinib with SU11274 combination treatment were plotted. Points falling below the line represent synergistic drug interactions.