Figure 1.

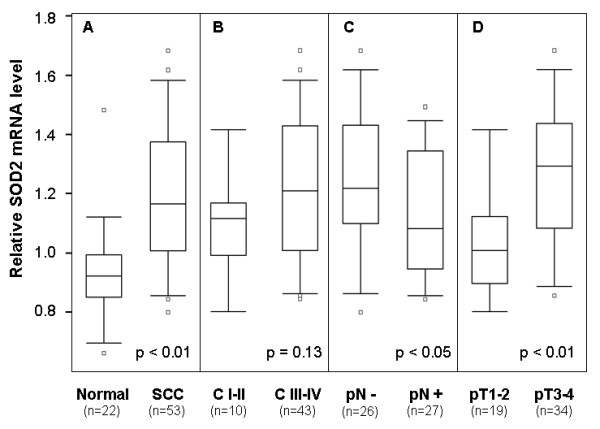
mRNA expression of SOD2 in TSCC based on pooled-analysis. Pooled-analysis was performed to extract the relative expression level of SOD2 mRNA from microarray datasets of 53 TSCCs and 22 normal control samples as described. Box plots were presented for comparing the SOD2 mRNA levels of SCC and normal control samples (A), clinical stage I-II and clinical stage III-IV SCC samples (B), SCC samples with (pN+) and without lymph node metastasis (pN-) (C), and SCC samples with different pT stages (D). The p-values were computed using one-way ANOVA. The boxes represent 25th to 75th percentile of the observations, and the lines in the middle of the box represent the median. The whiskers represent maximum (or minimum) observations below (or above) the 1.5 times of the interquartile range (IQR), respectively. Outliers are also indicated in the plots as small circles.
