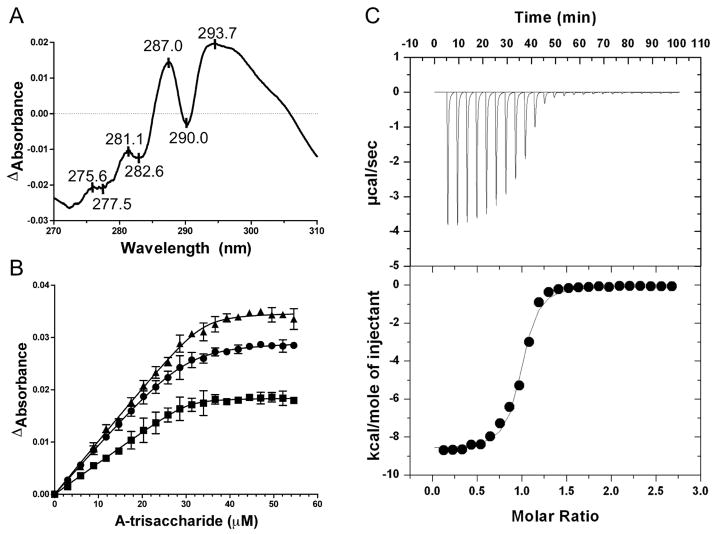
Figure 2.
The interaction FcsSBP with carbohydrates. A) The UV difference spectrum induced by the binding of the A-trisaccharide to FcsSBP. Peaks and troughs in the spectrum are labelled. B) An isotherm of FcsSBP binding to the A-trisaccharide produced by a UV difference titration. Each curve corresponds to a different peak-to-trough wavelength pair used to measure the change in UV absorbance upon ligand binding: triangles, 287.0-282.6 nm pair; circles, 293.7-290.0 nm pair; and squares, 287.0–290.0 nm pair. Error bars show the standard deviation of triplicate measurements. Solid lines show the fits to a one-site binding module accounting for ligand depletion. C) Representative isothermal titration calorimetry titration for the A-trisaccharide. The upper panel shows the unintegrated data corrected for baseline. The lower panel shows the integrated heats fit to a one-site binding model.

