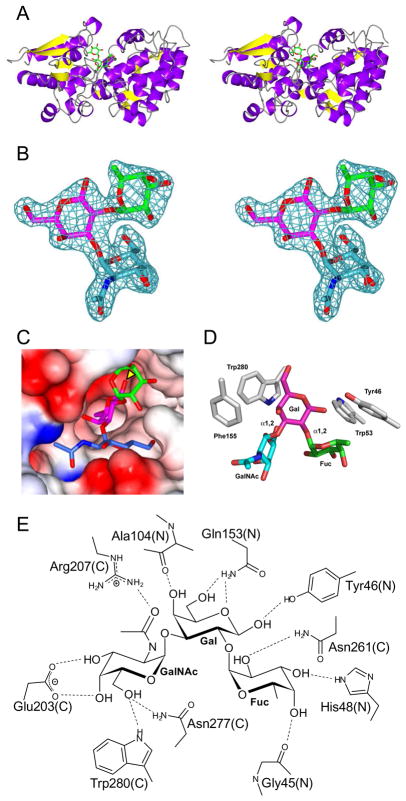
Figure 3.
X-ray crystal structure of the FcsSBP from Streptococcus pneumoniae SP3-BS71. A) The divergent stereo diagram of the FcsSBP structure shows the bilobed structure of the protein and the general location of the ligand binding site. The blood group A-trisaccharide ligand is shown in green stick representation. B) The high quality of the electron density of the bound A-trisaccharide ligand is shown in the divergent stereo maximum-likelihood/σa-weighted Fobs-Fcalc maps 47, 50 (contoured at 3σ = 0.21 e−/Å2) produced by refinement of the FcsSBP structure with the A-trisaccharide coordinates omitted. The electron density is shown as blue mesh while the ligand is shown in stick representation (green, fucose; pink, galactose; and blue/cyan, N-acetylgalactosamine). C) The binding site of the FcsSBP is a deep pocket formed upon the convergence of the N- and C-terminal domains. The reducing end of the sugar (indicated with a yellow arrow) pointing into the binding site. The sugar is color coded as in panel B with the protein shown as a solvent accessible surface colored by electrostatic potential (red, negative; blue, positive). D) The aromatic “cradle” of the active site comprises three sidechains, which are shown in grey stick representation and labelled. The ligand is shown as in panel C. E) Hydrogen bonding schematic of the binding site. The contributions of amino acids from the N- and C-terminal domains are indicated with a N and C respectively.

