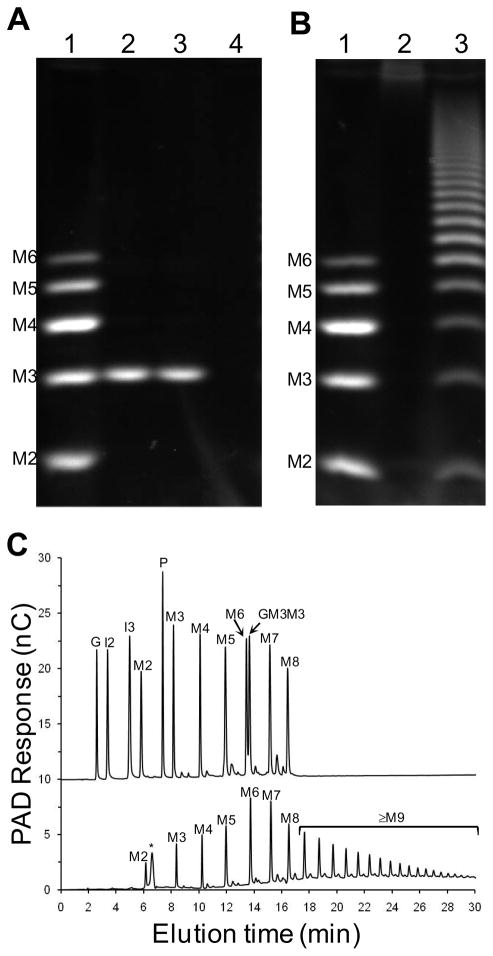
Figure 2.
Product profiles of pullulan and glycogen hydrolyzed by SpuA. A) FACE analysis of product produced by SpuA treatment of pullulan. The lanes are as follows: 1, maltooligosaccharide standards (M2–M6 indicate maltose to maltohexaose, inclusively); 2 and 3, SpuA treated pullulan; 4, untreated pullulan. B) FACE analysis of product produced by SpuA treatment of glycogen. The lanes are as follows: 1, maltooligosaccharide standards; 2 untreated glycogen; and 3, SpuA treated glycogen. C) HPAEC-PAD analysis of glycogen treated by SpuA. The upper trace shows a mixture of sugar standards - the unique elution positions of the sugars were first determined by analysis of the individual sugars. The peak labels are as follows: G, glucose; I2, isomaltose; I3, isomaltotriose; M2-M8, maltose to maltooctaose; P, panose; and GM3M3; 63-α-D-glucosyl-maltotriosyl-maltotriose. The lower trace shows the product profile of SpuA treated glycogen. Untreated glycogen (not shown) showed only a peak corresponding to the small peak indicated in the lower trace of panel C by an asterisk (*). The peaks are labelled as in the upper trace according to the deduced identity of the sugars.

