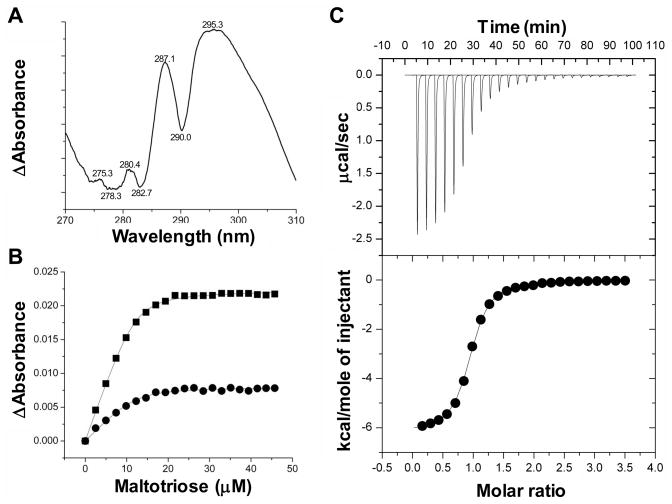
Figure 3.
Representative binding experiments showing the interaction MalX with maltotriose. A) The UV difference spectrum induced by the binding of maltotriose to MalX. Peaks and troughs in the spectrum are labelled. B) A representative isotherm of maltotriose to MalX produced by a UV difference titration. Each curve corresponds to a different peak-to-trough wavelength pair used to measure the change in UV absorbance upon ligand binding: circles, 287.1–282.7 nm pair; and squares, 295.3–290.0 nm pair. Solid lines show the fits to a one-site binding model accounting for ligand depletion. C) Representative isothermal titration calorimetry titration for maltotriose. The upper panel shows the unintegrated data corrected for baseline. The lower panel shows the integrated heats fit to a one-site binding model.

