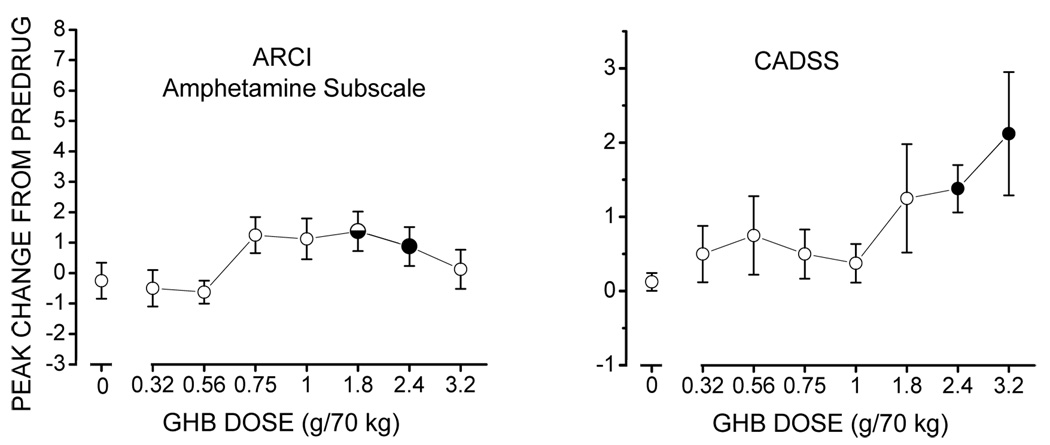
Figure 2.
Effects of GHB on self-report (left panel) and observer-rated (right panel) measures at time of peak effect. Each point represents the mean +/− standard error in 8 participants. The horizontal axis represents GHB dose (g/70 kg). The vertical axis represents peak change from predrug measures. Filled and half-filled circles represent significant (p≤0.05) and trends toward significant (0.05<p≤0.1) differences, respectively, relative to placebo. ARCI - Addiction Research Center Inventory Short Form; CADSS - Clinician Administered Dissociated States Scale.

