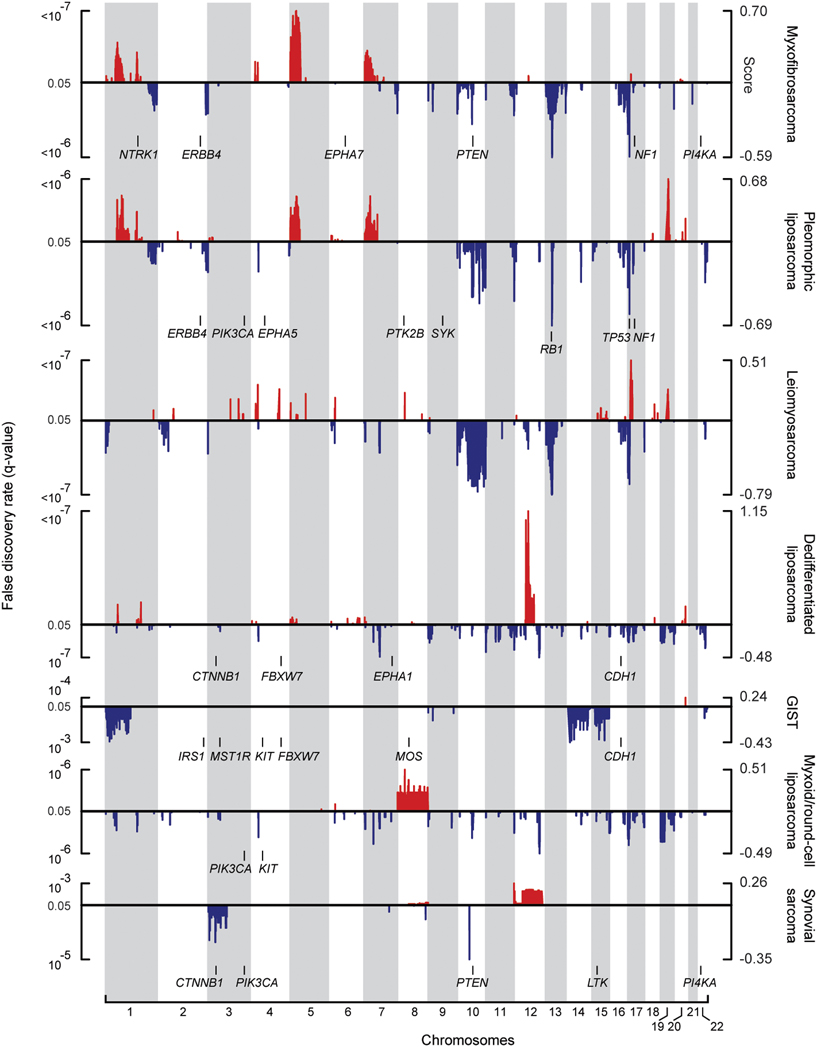
Figure 1. Nucleotide and copy number alterations in soft-tissue sarcoma subtypes.
The statistical significance of genomic aberrations for each subtype is shown. RAE q-values [left axis; for visualization, q-values ≤ 0.05 are considered significant, corresponding false discovery rate (FDR) ≤ 5%] and scores (right axis) for gains and amplifications (red) and losses and deletions (blue) are plotted across the genome (chromosomes indicated at bottom). Genes harboring somatic nucleotide alterations in this study are indicated in each subtype in which they were discovered (Table 2).

