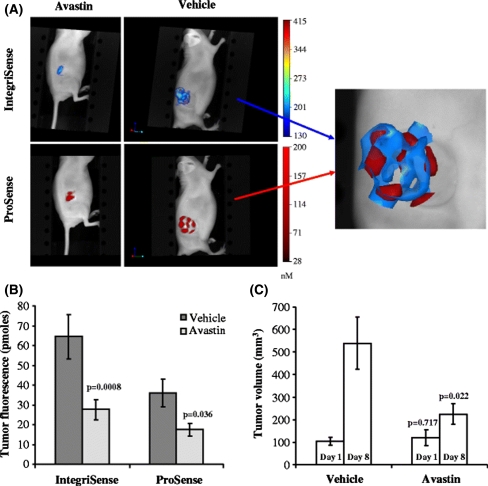
Fig. 6.
Effect of antiangiogenic Avastin treatment on αvβ3 integrin and cathepsin B signals in A673 tumor-bearing mice. a Representative volume renderings of IntegriSense and ProSense. Note the differential localization of fluorescent signal with IntegriSense and ProSense in the same animals (IntegriSense in blue and ProSense in red). b Quantification of tumor fluorescence shows that IntegriSense and Prosense signal in tumors is decreased following Avastin treatment (P = 0.0008 and P = 0.013, respectively). c Avastin also significantly inhibits tumor growth as determined by tumor volume calipers measurements (by 58.4%, P = 0.022). (Reprinted from Kossodo S, Pickarski M, Lin SA, Gleason A, Gaspar R, Buono C, Ho G, Blusztajn A, Cuneo G, Zhang J, Jensen J, Hargreaves R, Coleman P, Hartman G, Rajopadhye M, Duong LT, Sur C, Yared W, Peterson J, Bednar B. Dual In Vivo Quantification of Integrin-targeted and Protease-activated Agents in Cancer Using Fluorescence Molecular Tomography (FMT). Mol Imaging Biol 2009. [87])

