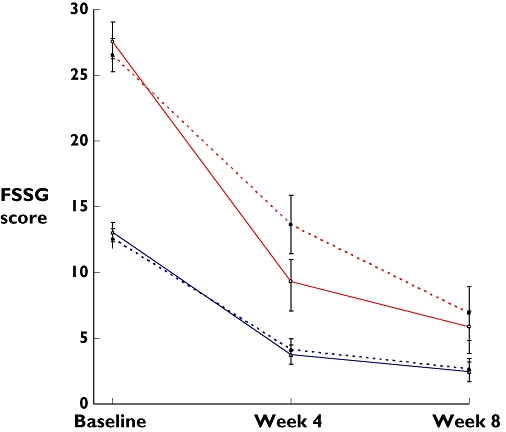
Figure 4.

FSSG scores over the trial period between the two treatment arms in subgroups of patients according to baseline scores. The upper two lines (red) indicate patients with baseline FSSG scores >18 points and the lower two lines (blue) refer to those with 18 points or fewer. Changes of symptom scores between the two medications were different only in the subgroup with baseline FSSG scores >18 at week 4. Data are expressed as mean ± SEM. FSSG, frequency scale for symptoms of gastro-oesophageal reflux disease. Placebo-mosapride ( ) (
) ( ); Mosapride-placebo (
 ) (
) ( )
)
