
Figure 6.
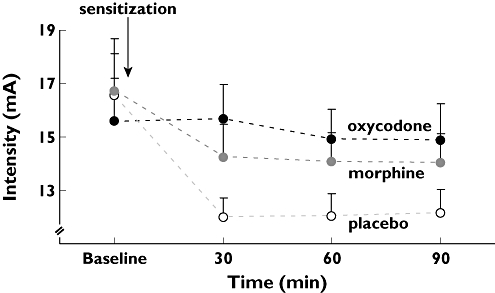
Results from painful electrical stimulation of the oesophagus. The stimulus intensities in pain detection thresholds to electrical stimulation of the oesophagus at baseline, 30, 60 and 90 min after drug administration are shown. Morphine (30 mg, grey), oxycodone (15 mg, black) and placebo (white). The effect of oxycodone, but not morphine, was better than placebo. The error bars represent SEM. To eliminate errors relating to differences in baseline pain recordings (illustrated by a slightly lower baseline value for oxycodone in the figure), the change in stimulus intensity relative to baseline was used in the statistical analysis