
Figure 1.
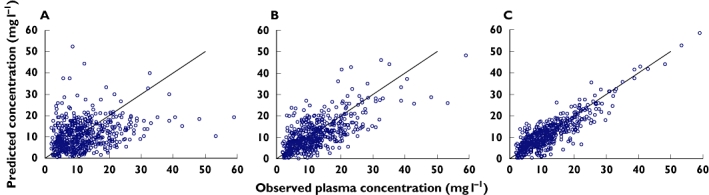
Goodness-of-fit plots: (A) Population predicted concentrations from basic model; (B) Population predicted concentrations from final model; and (C) Individual predicted concentrations from final model
Official websites use .gov
A
.gov website belongs to an official
government organization in the United States.
Secure .gov websites use HTTPS
A lock (
) or https:// means you've safely
connected to the .gov website. Share sensitive
information only on official, secure websites.
Goodness-of-fit plots: (A) Population predicted concentrations from basic model; (B) Population predicted concentrations from final model; and (C) Individual predicted concentrations from final model